Top 10 Business Intelligence Applications
Business intelligence applications help organizations collect, manage, analyze, and interpret data to make informed decisions. These applications act as the backbone of any company’s data-driven decision-making process.
With a plethora of Business Intelligence (BI) applications in the market, it can be challenging to find the right one that fits your organization’s needs. This article lists the top 10 business intelligence applications for businesses of all sizes and industries.
1. Microsoft Power BI
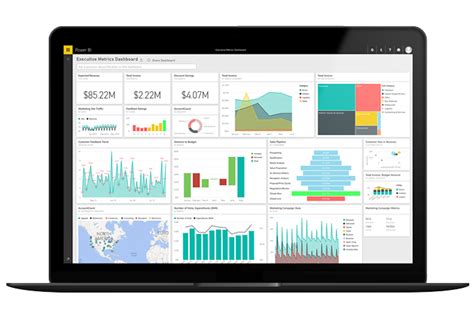
Microsoft Power BI is a cloud-based BI tool that integrates with other Microsoft platforms like Excel, SQL Server, SharePoint, and more. It allows users to visualize data and share insights across the organization in just a few clicks. It provides an intuitive user interface for users to create reports, interactive dashboards, and real-time data analytics.
Some of Microsoft Power BI’s key features include data visualization, drag-and-drop report designing, AI-powered insights, collaboration, and security.
2. Tableau
Tableau is a data visualization and business intelligence tool that helps businesses see and understand their data. It allows users to connect and blend data from multiple sources, create visualizations, and share insights with colleagues.
Tableau’s features include interactive dashboards, ad-hoc analysis, collaboration, and an extensive library of pre-built data connectors.
3. QlikView
QlikView is a data discovery and visualization tool that helps businesses make informed decisions. It enables users to analyze data from multiple sources, create custom dashboards, and share insights across the organization.
QlikView’s features include a self-service interface, drag-and-drop functionality, real-time data analytics, and collaboration tools.
4. SAP BusinessObjects
SAP BusinessObjects is a business intelligence suite that helps organizations gain a better understanding of their data. It provides tools for reporting, analysis, and visualization of data from various sources, including databases, Excel spreadsheets, and cloud-based systems.
SAP BusinessObjects’ key features include ad-hoc reporting, analytics, data visualization, and data governance.
5. MicroStrategy
MicroStrategy is a cloud-based business intelligence platform that enables users to analyze and visualize data from multiple sources easily. It offers a suite of analytical tools, including data discovery, interactive dashboards, and predictive analytics.
MicroStrategy’s features include self-service data discovery, a mobile app, real-time analytics, and collaboration tools.
6. IBM Cognos Analytics
IBM Cognos Analytics is a business intelligence platform that provides a unified workspace for analytics and reporting. It enables users to create interactive reports, dashboards, and visualizations from multiple sources, including databases, spreadsheets, and cloud-based systems.
IBM Cognos Analytics’ key features include self-service analytics, real-time data analytics, ad-hoc reporting, and collaboration tools.
7. SAS Business Intelligence
SAS Business Intelligence is a data analytics platform that provides tools for reporting, analysis, and data visualization. It allows users to access data from multiple sources, including databases, spreadsheets, and cloud-based systems.
SAS Business Intelligence’s key features include data visualization, predictive analytics, ad-hoc reporting, and collaboration.
8. Looker
Looker is a cloud-based business intelligence platform that enables users to explore and analyze data from multiple sources easily. It provides a self-service analytics platform that allows users to create custom reports and dashboards without any coding knowledge.
Looker’s features include data exploration, custom data modeling, real-time analytics, and collaboration tools.
9. Domo
Domo is a cloud-based business intelligence platform that provides real-time insights into an organization’s data. It enables users to connect to multiple data sources, create dashboards and reports, and share insights with colleagues.
Domo’s key features include data visualization, self-service analytics, real-time analytics, and collaboration tools.
10. TIBCO Spotfire
TIBCO Spotfire is a data analysis and visualization tool that helps businesses explore and analyze data from multiple sources. It provides a user-friendly interface that enables users to create dashboards and reports with just a few clicks.
TIBCO Spotfire’s features include data visualization, self-service analytics, predictive analytics, and collaboration tools.
Final Thoughts
Choosing the right business intelligence tool is vital to an organization’s success as it helps them make informed decisions based on data insights. This list provides a comprehensive overview of the top 10 business intelligence applications for businesses of all sizes and industries.
Each of these applications has its features, strengths, and limitations, and it’s essential to evaluate them carefully before choosing one that is best suited for your organization’s needs.
Frequently Asked Question
1. What is Business Intelligence (BI) application?
Business Intelligence (BI) application is a software solution used to gather, process and analyze data with the aim of improving organizational decision-making and performance.
2. What are the benefits of using BI applications?
BI applications provide a range of benefits including improved decision making, identification of growth opportunities, cost reductions, increased revenue, and improved operational efficiency.
3. What data sources can BI applications be integrated with?
BI applications can be integrated with different types of data sources such as databases, spreadsheets, CRM systems, social media, and cloud-based services among others.
4. What types of analytics are supported by BI applications?
BI applications support different types of analytics including descriptive, predictive and prescriptive analytics.
5. What are some common features of BI applications?
Some common features of BI applications include reporting, data visualization, dashboarding, ad hoc querying, and drill-down capabilities.
6. What skills are required to use BI applications?
Skills required to use BI applications include data visualization and analysis, reporting, data modeling, and data warehousing among others.
7. Can BI applications be customized to fit unique organizational needs?
Yes, BI applications can be customized to fit unique organizational needs through development, configuration or customization of the application.
8. What is the difference between BI and analytics applications?
BI applications are used to gather, process and analyze data to help organizations make informed decisions. Analytics applications are used to extract insights from data.
9. Is training required to use BI applications?
Yes, training is required to use BI applications. Most BI applications offer training materials on how to use the application.
10. What are the security considerations for BI applications?
Security considerations for BI applications include access control, authentication, authorization, data protection, and data encryption among others.